In this post, I want to describe my Proof-of-Concept project. I have always been fascinated by wind turbines. As a child, I remember seeing them during family trips to the Hel Peninsula in Poland. There was something powerful and elegant about them – massive structures quietly converting wind into energy. That image stayed with me. In 2025, I decided to challenge myself and learn something new, so I asked myself:
‘Why not build a SCADA system that could resemble a real-life wind turbine control system?’
I knew that if I wanted to make it meaningful, I would need: something to simulate wind turbine logic and process values, something to collect and store operational data, something to visualize technical parameters, and ideally something that could also present business-level KPIs, not only engineering data.
I didn’t want random numbers on a screen, and I wanted a small but realistic industrial ecosystem.
Since I wanted to build everything on my home laptop, I focused on free and accessible technologies. I wanted the project to be fully reproducible without requiring expensive industrial hardware or commercial licenses.
The project was built using:
- CODESYS – PLC logic in Structured Text
- Ignition – SCADA visualization layer
- Grafana – KPI dashboards and data analytics
- OPC UA – communication between SCADA and PLC
- MySQL – data storage
- Modbus TCP simulator – classic field protocol used to simulate some field devices
- GitHub – version control (work in progress)
Below, I described the technologies used.
Codesys
In CODESYS, I implemented both the control logic and the process value simulation. They were implemented in Structured Text because it allows clear implementation of complex calculations, making it a modern approach that is easy to read and even AI-friendly (e.g., GitHub Copilot, ChatGPT), and can be connected to a repository on GitHub.
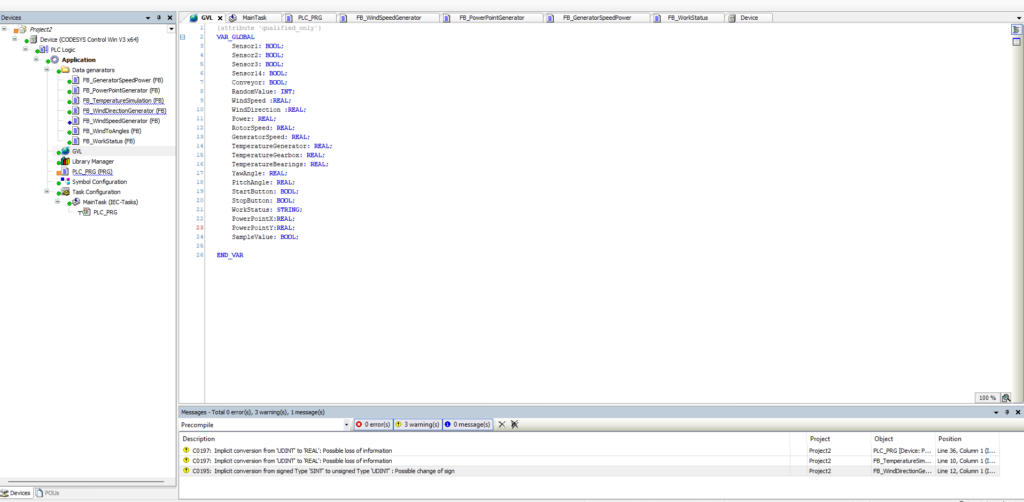
The architecture was modular. I created multiple Function Blocks (FBs), which were executed cyclically in PLC_PRG. All global process variables were defined in a Global Variable List (GVL), ensuring data exchange with SCADA.
Function Blocks implemented:
- FB_GeneratorSpeedPower – calculates rotor and generator speed in RPM and determines turbine power output based on wind speed, wind direction, and turbine parameters. In this project, I assumed a 2 MW turbine with a rotor radius of 40 meters.
- FB_PowerPointGenerator – calculates two characteristic points on the power curve (wind speed vs. power output), used to approximate turbine performance behavior.
- FB_TemperatureSimulation – simulates temperatures of the generator, bearings, and gearbox, including load-dependent thermal behavior.
- FB_WindDirectionGenerator – generates dynamically changing wind direction values expressed in degrees.
- FB_WindSpeedGenerator – simulates wind speed variation in meters per second (m/s), within realistic operational limits.
- FB_WindToAngles – calculates pitch and yaw angles based on current wind speed and direction to simulate aerodynamic alignment.
- FB_WorkStatus – manages the turbine state machine, including states such as Running, Too Windy, No Wind, Alarm, Service, and Off.
I implemented an OPC UA server within CODESYS to enable data exchange with Ignition. This allowed seamless real-time communication between the PLC simulation layer and the SCADA system.
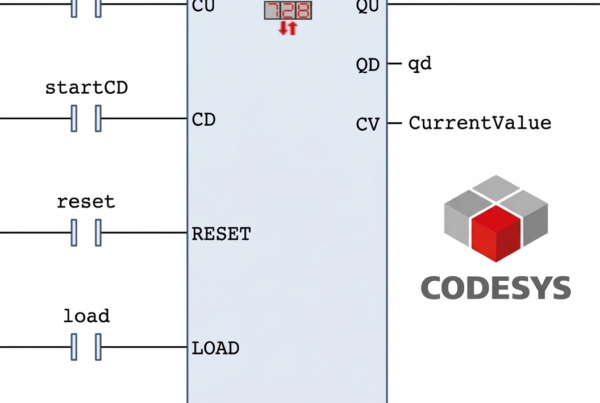
I described shortly my FB_GeneratorSpeedPower, where I calculated rotor and generator speed and the turbine’s power. For this project, I assumed a wind turbine with a maximum power of 2 MW and a rotor radius of 40 m. The FB_GeneratorSpeedPower Function Block takes wind speed and wind direction as inputs, and outputs rotor RPM, generator RPM, and instantaneous power on the generator.
Calculations are based on physical principles.
I added principles and some of my code from FB_GeneratorSpeedPower.
Rotor swept area
The rotor swept area determines how much wind energy the turbine can intercept. It is calculated from the rotor radius :
Area := 3.1416 * Radius * Radius;
Wind power intercepted by the rotor
The wind power depends on the swept area and wind speed . It represents the total energy available from the wind:
WindPower := 0.5 * AirDensity * Area * WindSpeed * WindSpeed * WindSpeed;
Turbine power
The turbine power accounts for the aerodynamic efficiency of the rotor:
TurbinePower := Cp * WindPower;
Generator power
The generator power considers mechanical losses in the drivetrain ():
GeneratorPower := MechEff * TurbinePower;
Rotor angular velocity
The rotor angular velocity is derived from the tip speed ratio (TSR) and wind speed:
Omega := (TSR * WindSpeed) / Radius;
Rotor RPM
The rotor speed in revolutions per minute (RPM) converts angular velocity into a more intuitive metric:
RotorRPM := (Omega * 60.0) / (2.0 * 3.1416);
Generator RPM
The generator RPM is scaled from the rotor RPM using the gearbox ratio :
GeneratorRPM := RotorRPM * GearRatio;
Ignition
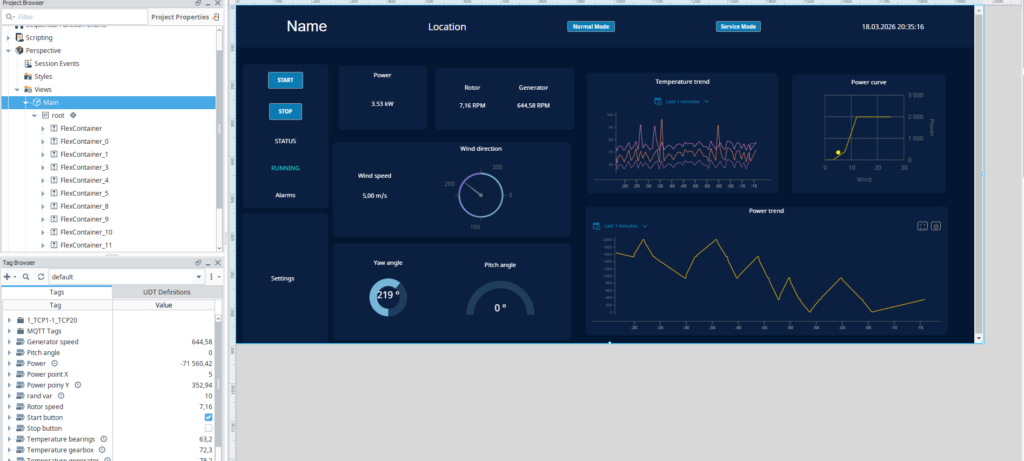
Monitoring a wind turbine with a SCADA system is crucial. It ensures safety, helps detect failures, and shows current power production. For my project, I built a wind turbine SCADA system using Ignition, running locally on my PC. Ignition acts as an OPC UA client, collecting data from Codesys, while PLC handles all control logic based on wind speed and direction. Jython scripts send data to a MySQL database every second. allowing to send data to upper layers.
I divided the interface into clear sections. The top bar shows basic info like turbine name, location, service mode button, and current date. The main area contains flex containers: one for start/stop buttons and turbine status, one for alarms, and another showing current operational data, including power, rotor and generator RPM, wind speed and direction, and yaw/pitch angles.
I also added three charts, all of which are real-time, but a user can simply connect to the historical chart version:
- Temperature trends for bearings, gearbox, and generator.
- Power trend over time.
- Power curve based on power over wind speed.
While the user can start or stop the turbine from Ignition, all control logic was made by the PLC. The SCADA system highlights current and past issues, shows power production, monitors wind parameters, and tracks turbine control angles.
To a more real-life effect, I simulate some field devices, adding some devices from the Modbus TCP simulator to Ignition. I have also added the Sparkplug MQTT plugin to Ignition for future use with MQTT brokers such as HiveMQ. While Ignition can theoretically act as a local MQTT broker for educational purposes, it is better to use an external broker, as would be done in real-life applications.
One of the best things about Ignition is how easy it is to integrate and how quickly you can prototype a system. It supports cutting-edge technologies, making it ideal for further analysis. I see possibilities to expand the project with reports, and there is potential to integrate with MQTT or AWS for IoT and cloud functionality. Currently, alarms and a few other things are still being refined (I have started a new project for the data center industry this month), and I hope they will be developed.
MySQL
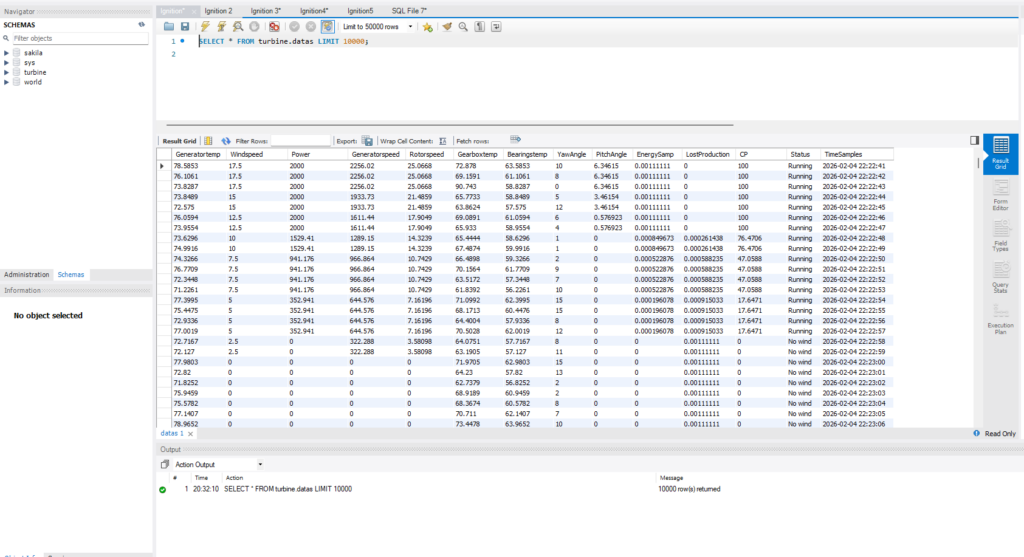
In my project, I used MySQL to store all turbine data. I send the data from Ignition using a script I wrote, once per second, and then the values are sent to Grafana for visualization. MySQL acts like a historian in a real-life SCADA system, keeping a record of all measurements over time. In the database, I initialized new columns, tested saving them, and deleted any incorrectly saved data. I can also calculate new values directly in the database, for example by multiplying existing values by constants, which makes it easy to generate derived metrics for monitoring or business calculations.
My home MySQL database has some limits and is not as large as an industrial historian. Still, it works perfectly for this proof-of-concept project, storing turbine data every second and allowing me to calculate derived values or visualize trends in Grafana. Even with a smaller setup, it demonstrates how a SCADA system records, monitors, and analyzes data over time.
Grafana

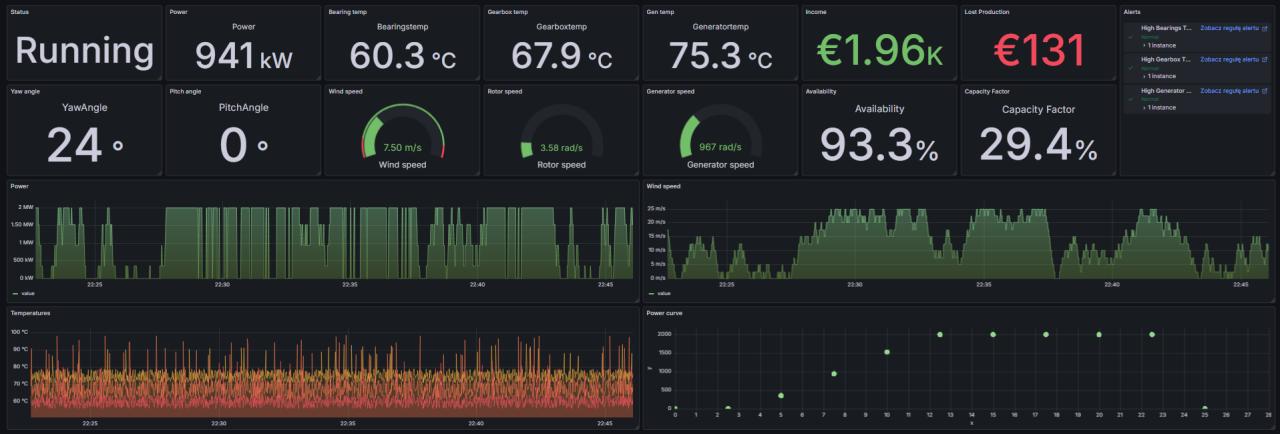
In my project, Grafana was used for data visualization and monitoring. I wanted my dashboard to show not only technical values, but also some business-related metrics. My goal was to create a dashboard that doesn’t just display raw data from the turbine (e.g., power output or SCADA readings), but also provides insights into technical performance and economic impact, for example, whether the turbine is operating properly and whether it generates enough revenue.
On the dashboard, there are panels with technical values such as rotor and generator RPM, power, and temperatures, as well as business metrics like revenue, lost production, availability, and capacity factor. At the bottom, I included trend charts showing historical data for generator, rotor, and bearing temperatures (useful to simulate alarms), wind speed, and generated power. I also plan to add a power curve panel with key points.
I added alerts to inform when the temperatures of the three key elements are outside the expected range. All data is pulled from a MySQL database, making the system both flexible and scalable. Grafana is very user-friendly, adding a new panel is as simple as dragging it onto the dashboard and connecting it to a data source.
This setup allows me to observe my turbine simulation in action in an aesthetic, professional-looking way. Many SCADA systems are functional but visually dull, whereas Grafana provides a clean, attractive interface while remaining fully industrial-grade. You know, all these gray screen SCADAs with vivid colors.