Free PLC course outline
- Lesson #1: What Is It and Why Should Every PLC Programmer Know It? Part #1
- Lesson #2: How to install Codesys? Part #2
- Lesson #3: Write your first program in Codesys: Structured Text – Part #3
- Lesson #4: How to Create a Codesys Visualization in an Application? – Part #4
- Lesson #5: Introduction to Variables in CODESYS – Part #5
- Lesson #6: Data Structures in CODESYS: Practical Use of Arrays and Structures – Part #6
- Lesson #7: Advanced Data Types. Enumerations and Local vs. Global Variables – Part #7
- Lesson #8: Operators – Introduction and Practical Applications – Part #8
- Lesson #9: Program Flow Control: IF, CASE, and Loops – Part #9
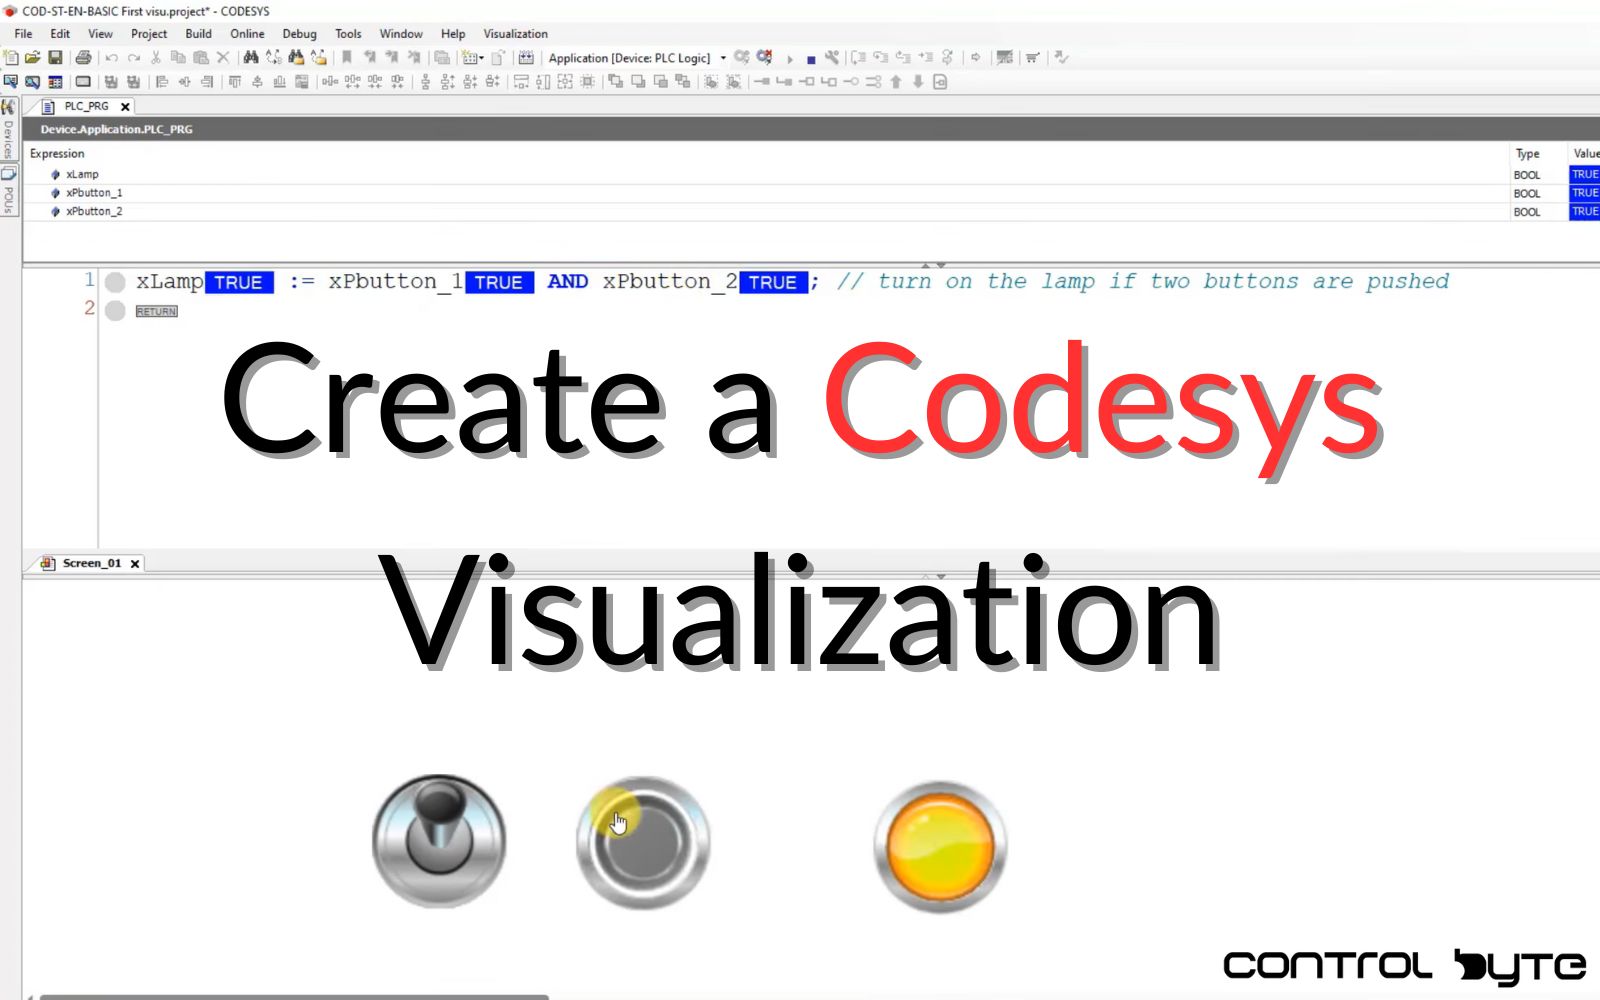
Creating a Codesys Visualization in an application might seem complex, but with this step-by-step guide, it will become simple. In this post, we will show you how to add a visualization manager, create a screen, and connect variables to interface elements.
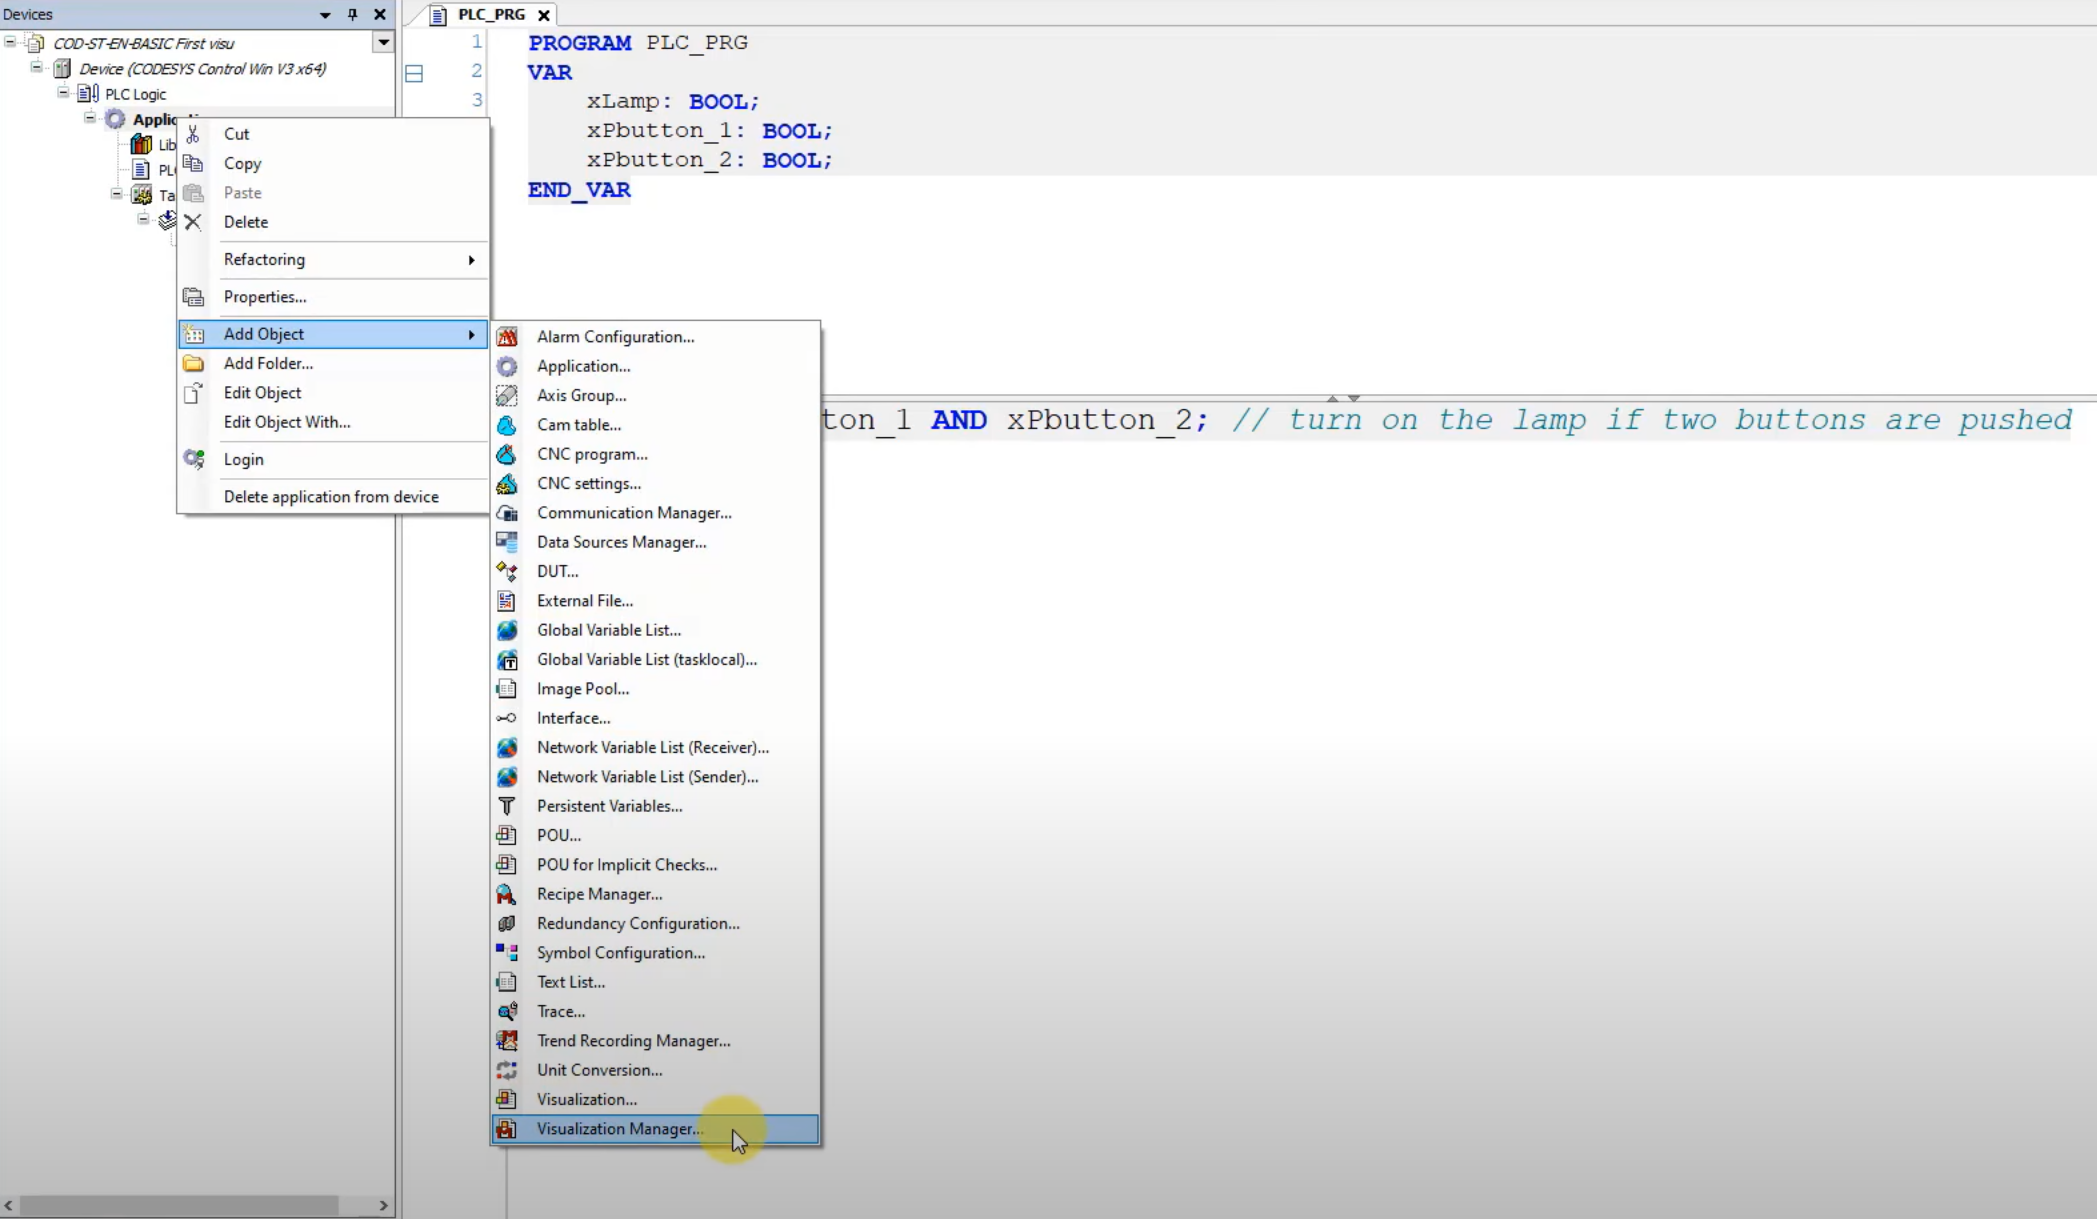
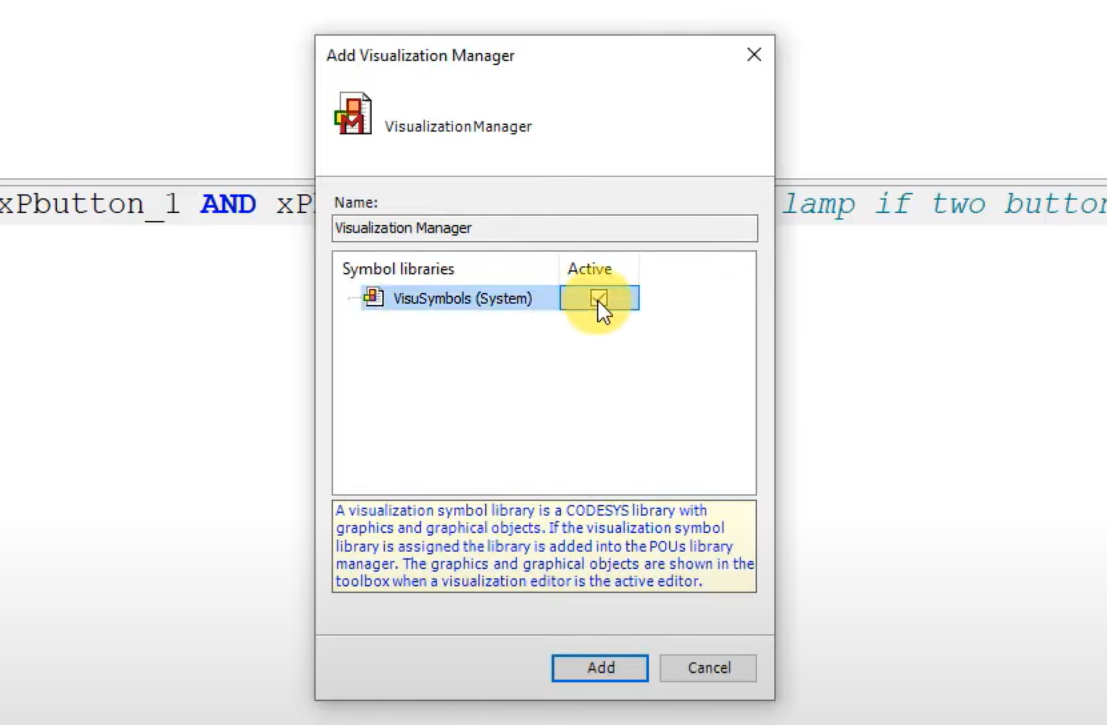
Adding the Visualization Manager
- In the Project Tree, right-click on Applications.
- Select Add Object.
- Choose Visualization Manager.
- In the Visualization Manager window, you will find various options – you can choose a visualization style.
- Click the ADD button to add the visualization manager.
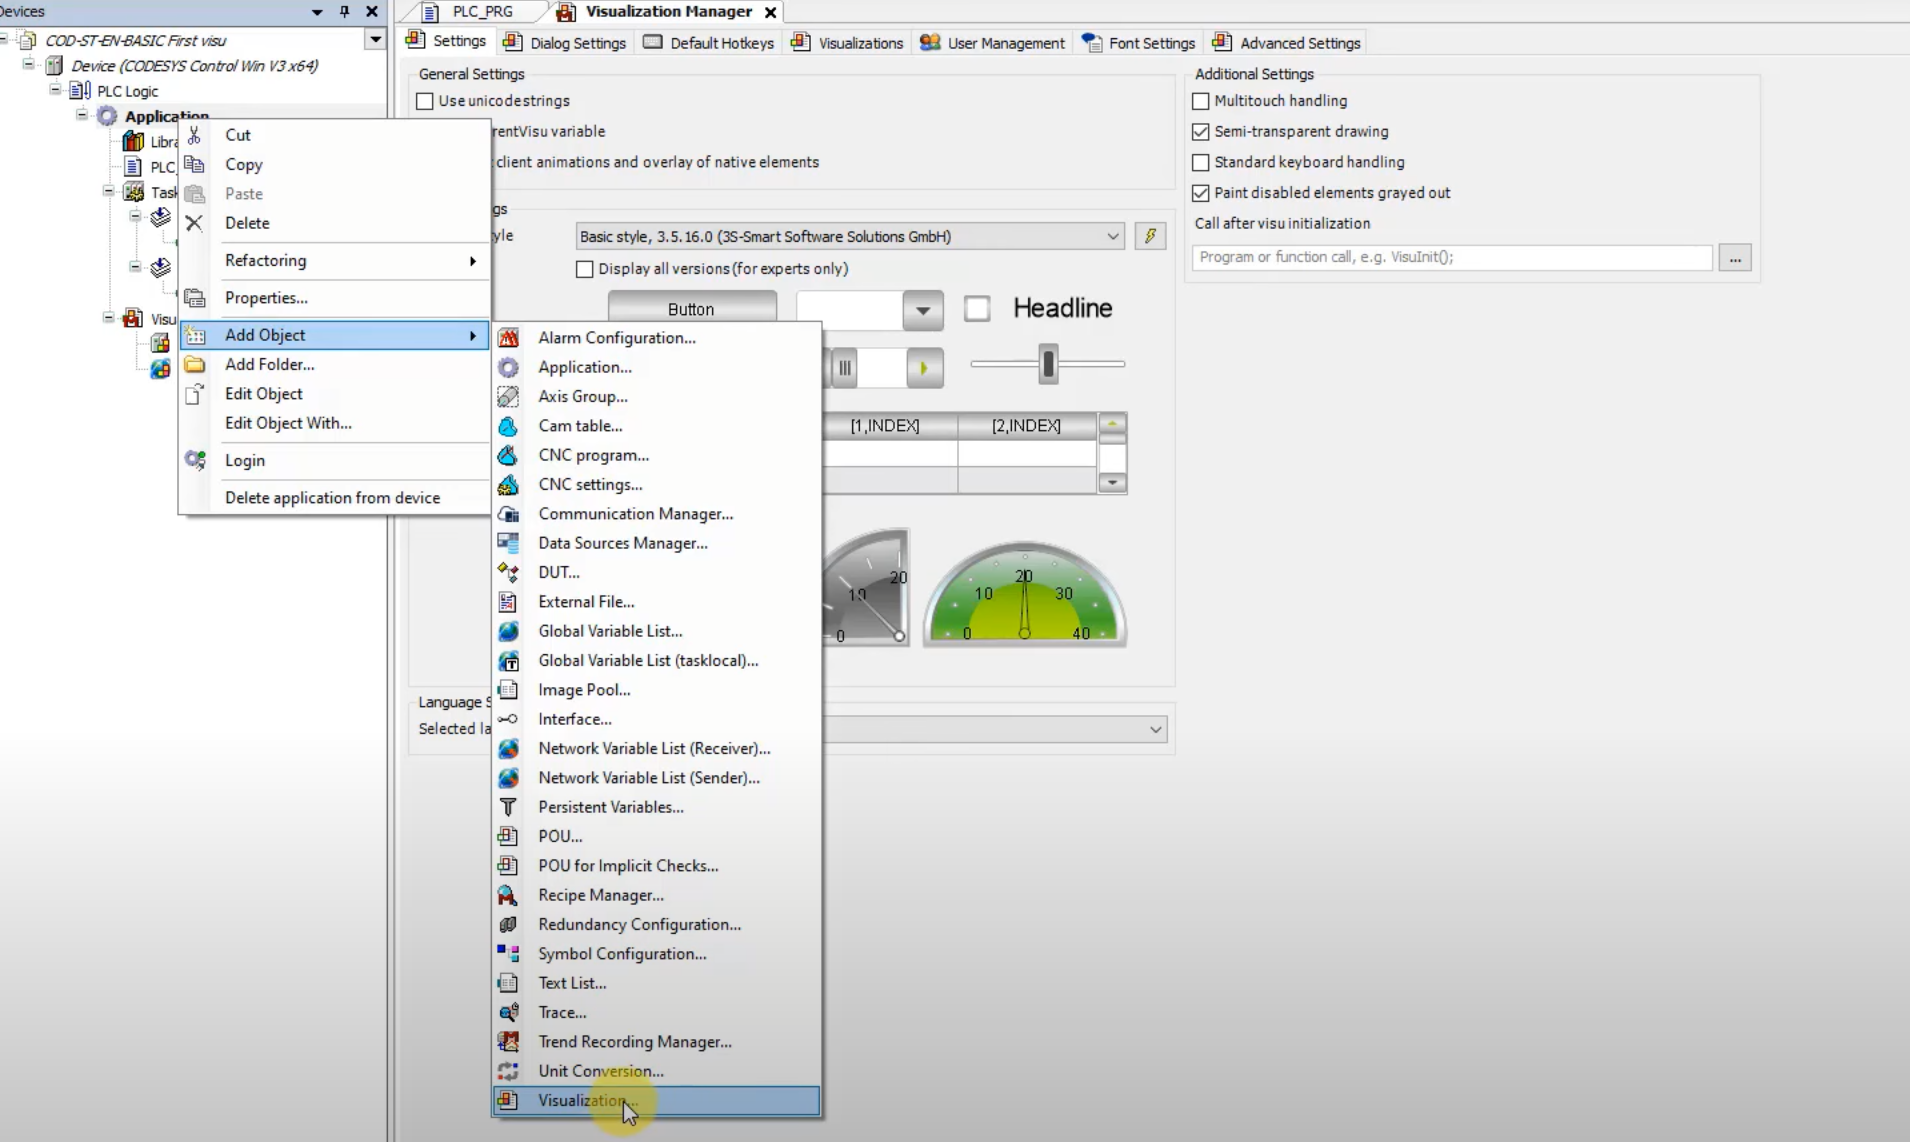
Creating the First Screen
- Go back to the Project Tree and right-click again on Applications.
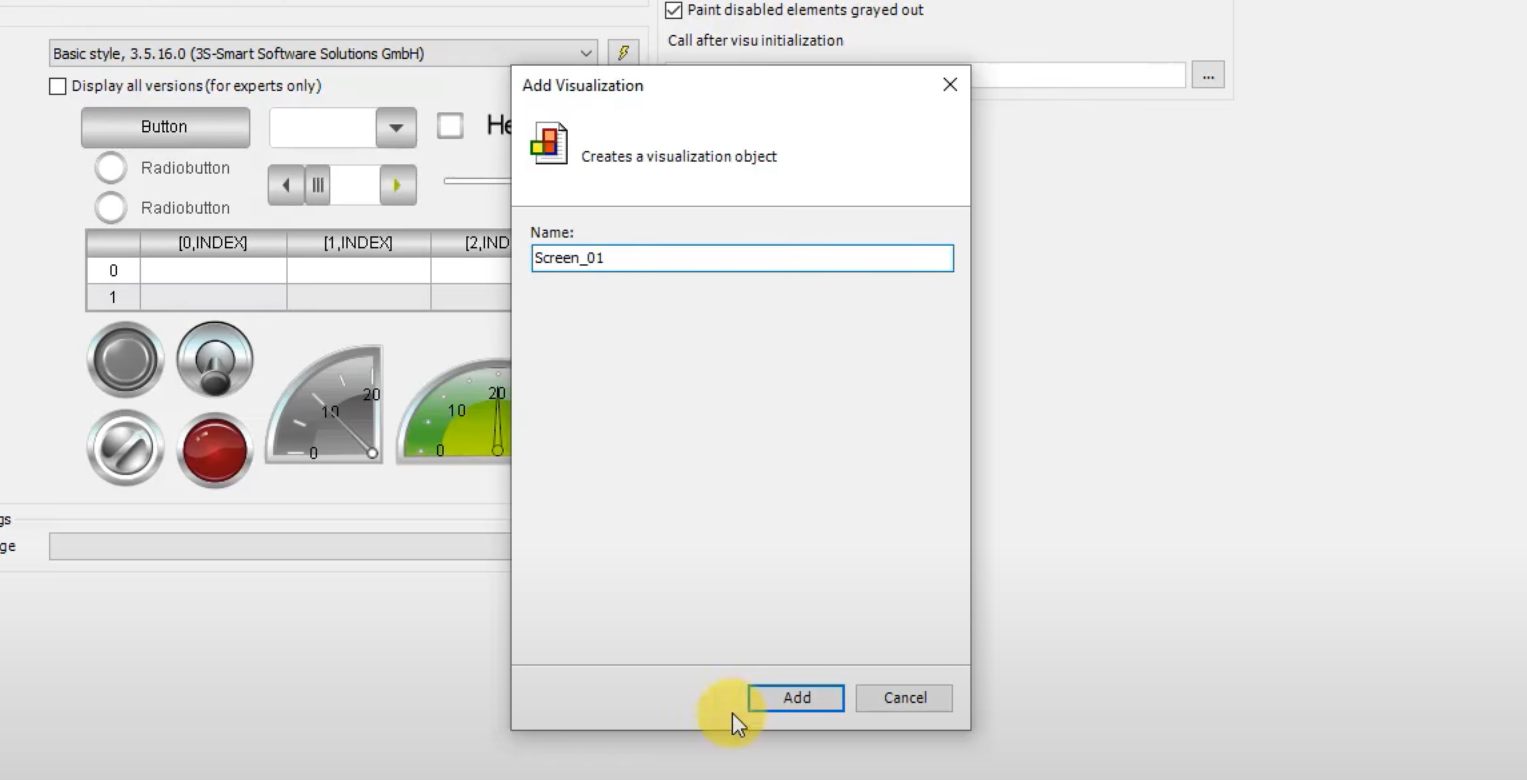
- Select Add Object and add a new Visualization.
- Name the screen, e.g., Screen_01, and confirm.
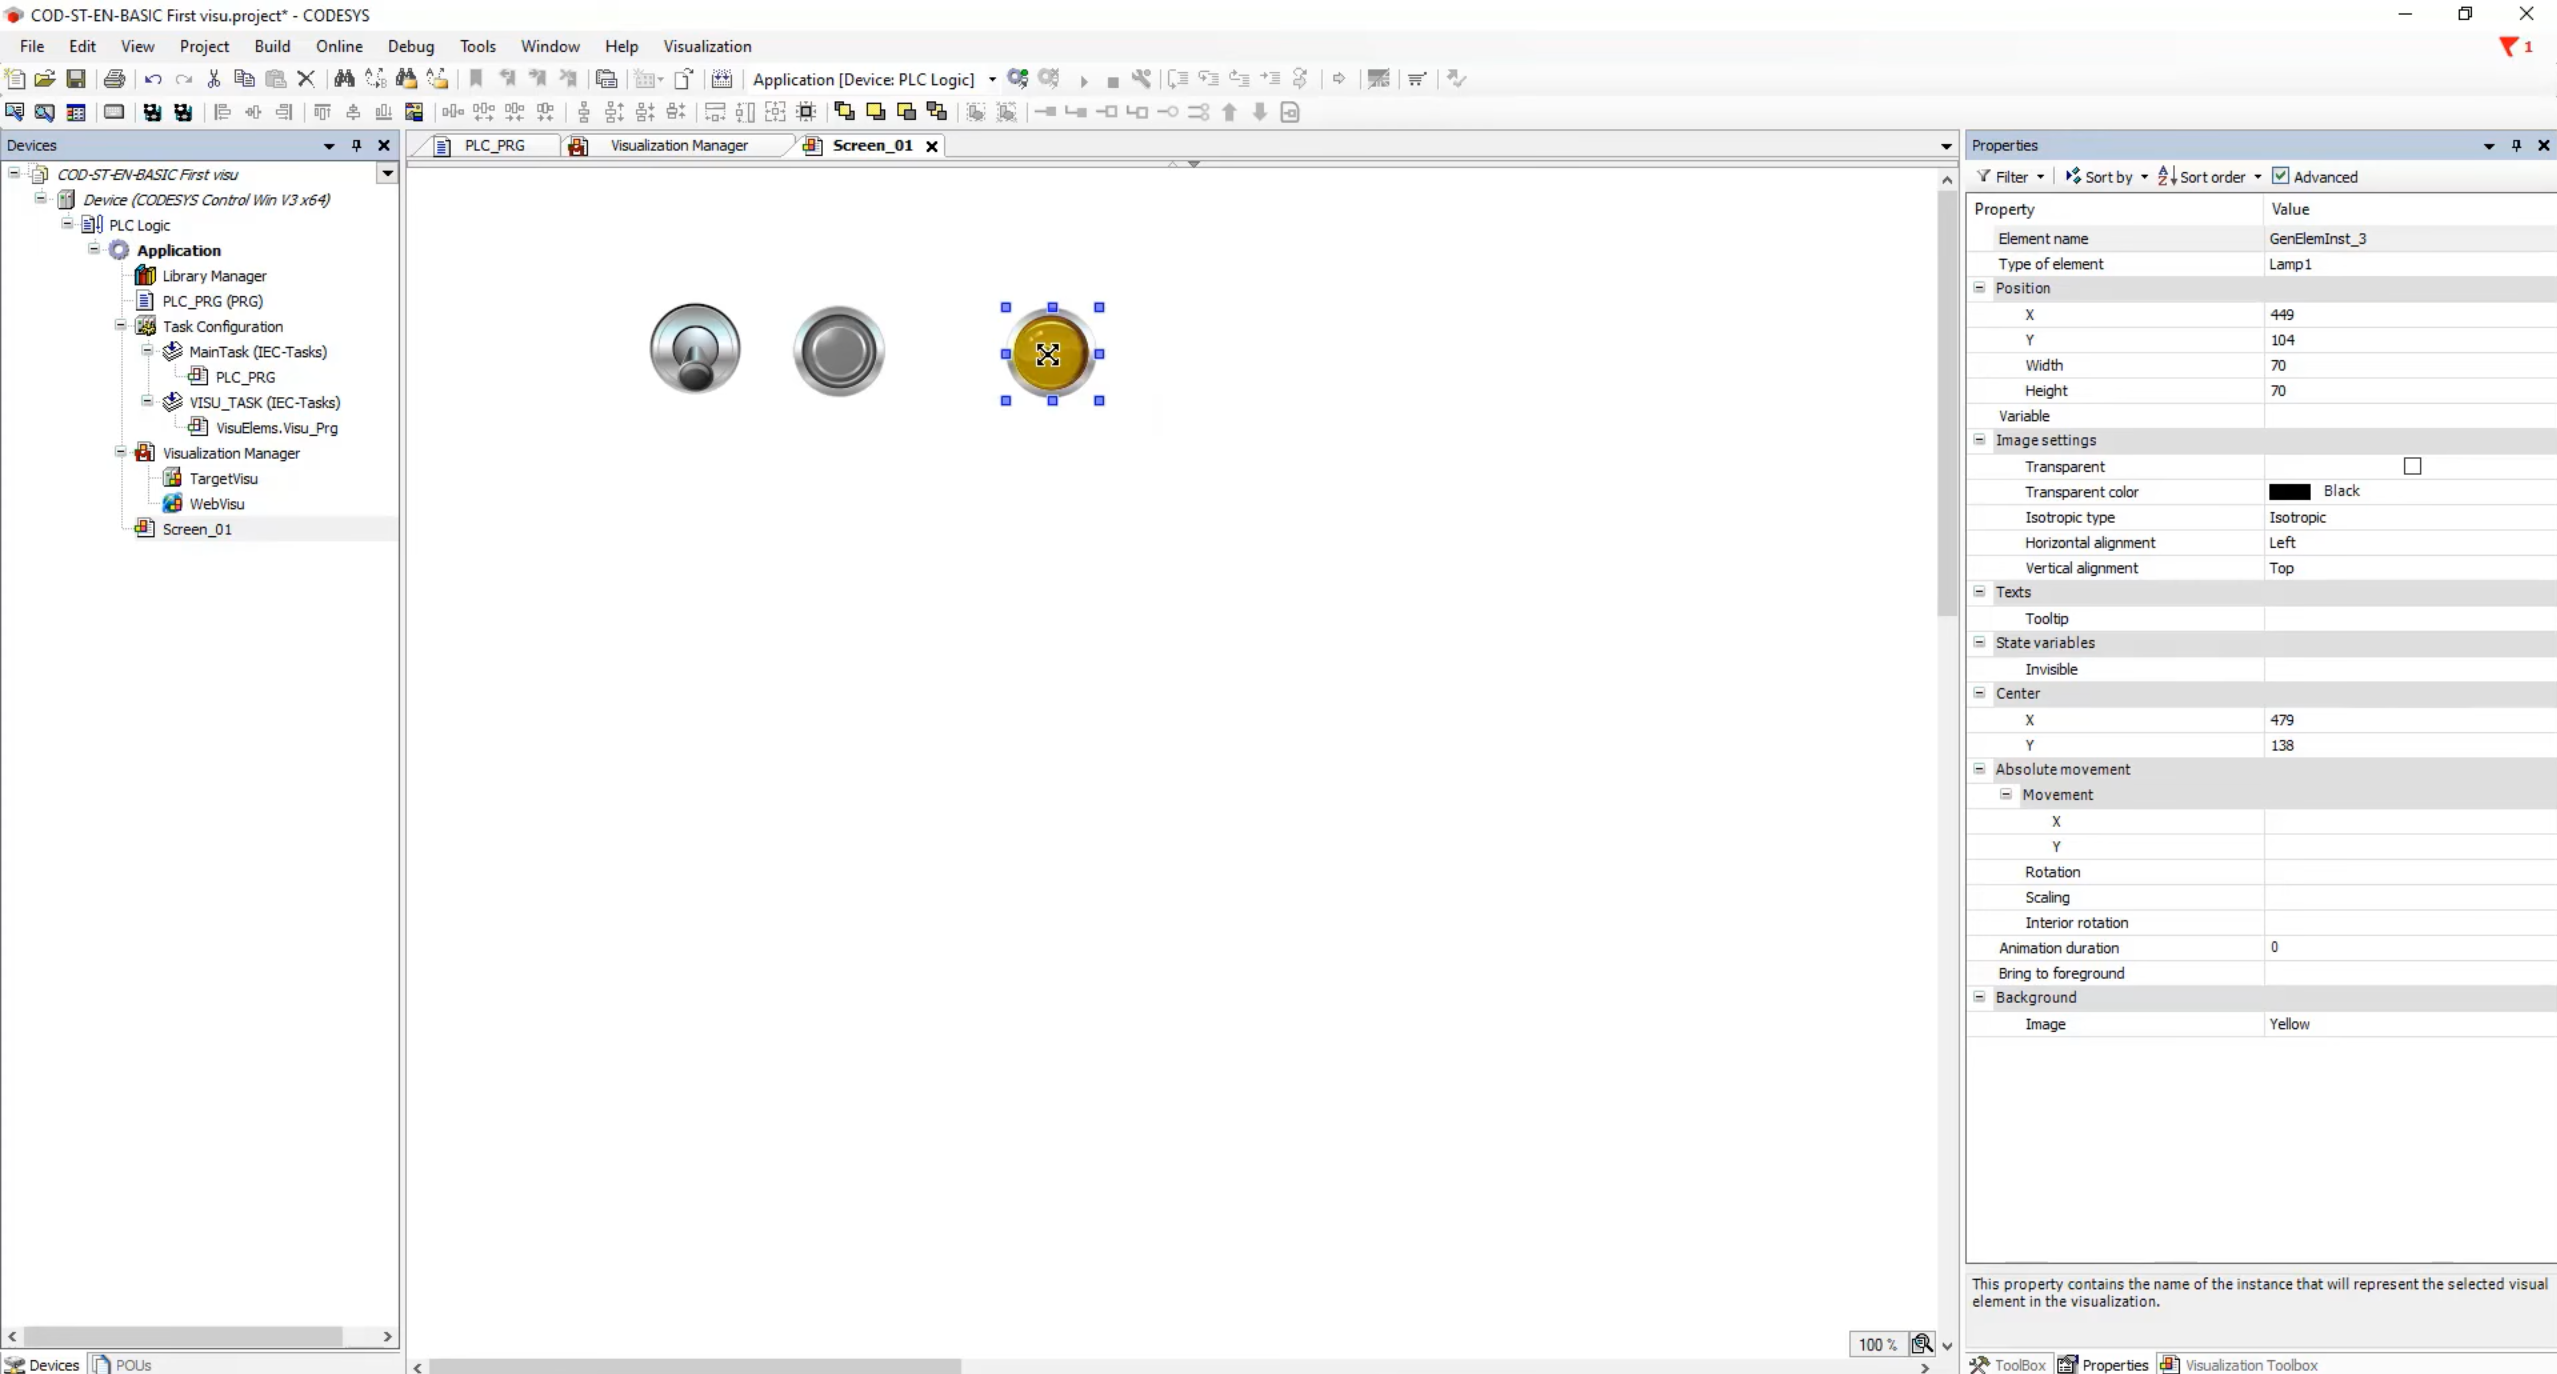
- Now you have a view of the newly created screen.
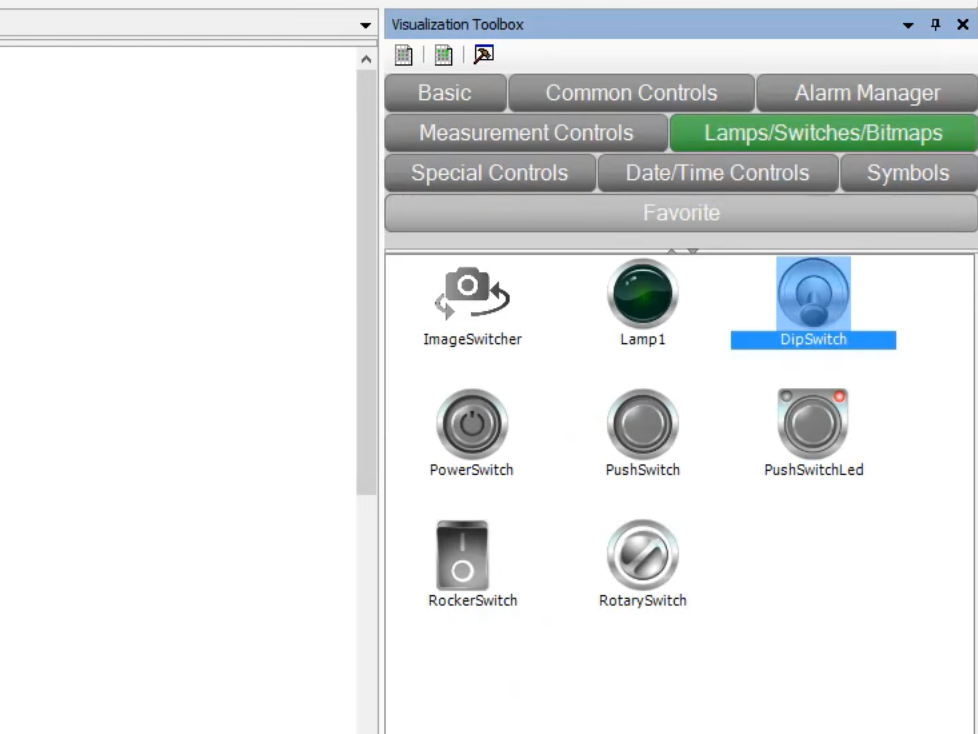
Adding user Interface Elements
- Go to the Visualization tab.
- Select the Lamp and Switches section.
- Drag and drop a Dip Switch on to the screen.
- Return to the Visualization Toolbox.
- Choose Push Switch and drag it onto the screen.
- Add a lamp by dragging and dropping it onto the screen.
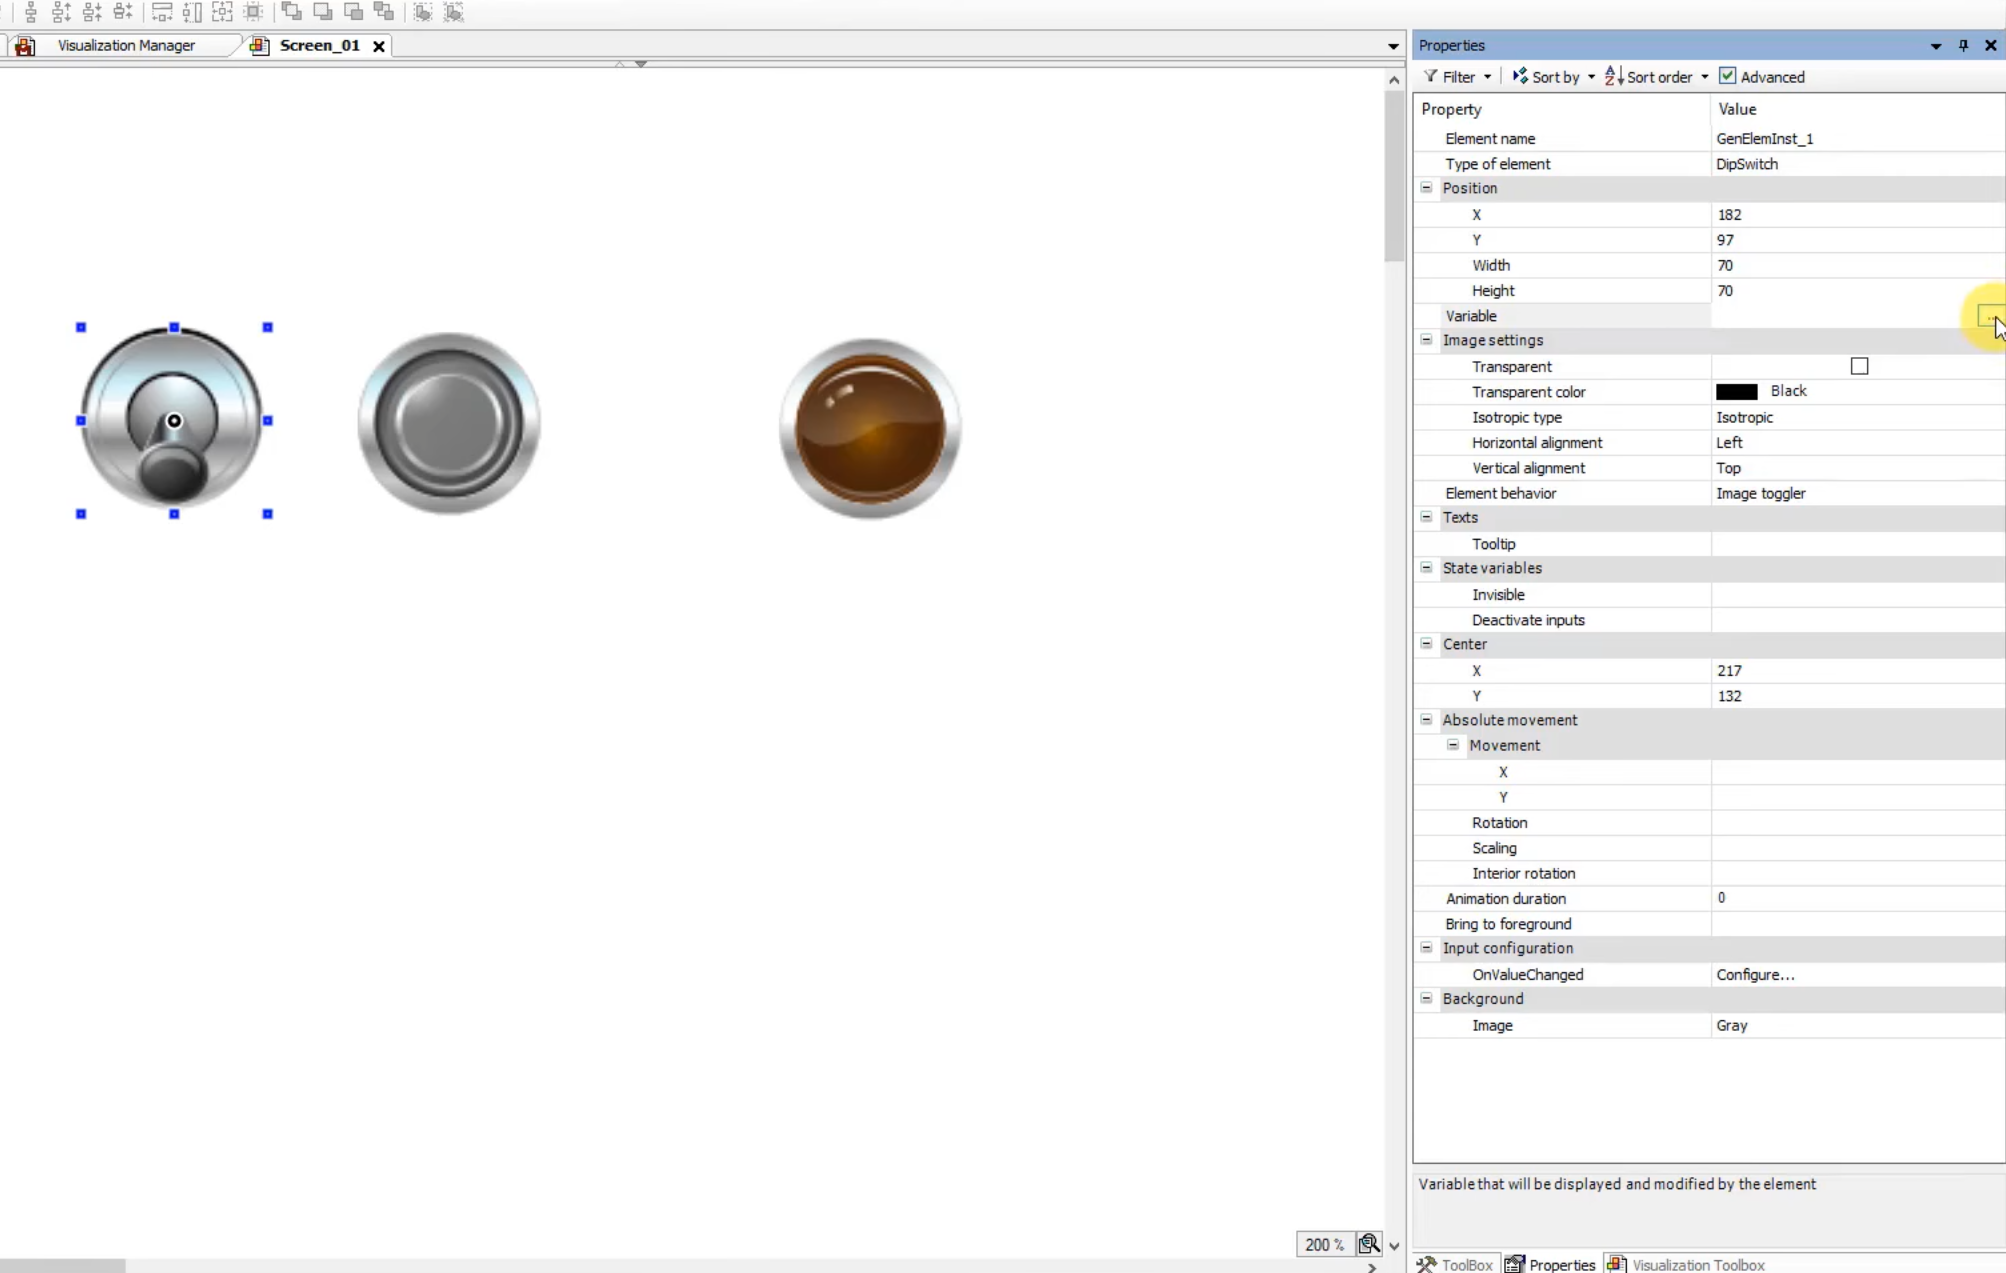
Connecting Variables to Interface visualization Elements
- Click on the first button (Push Switch), go to Properties.
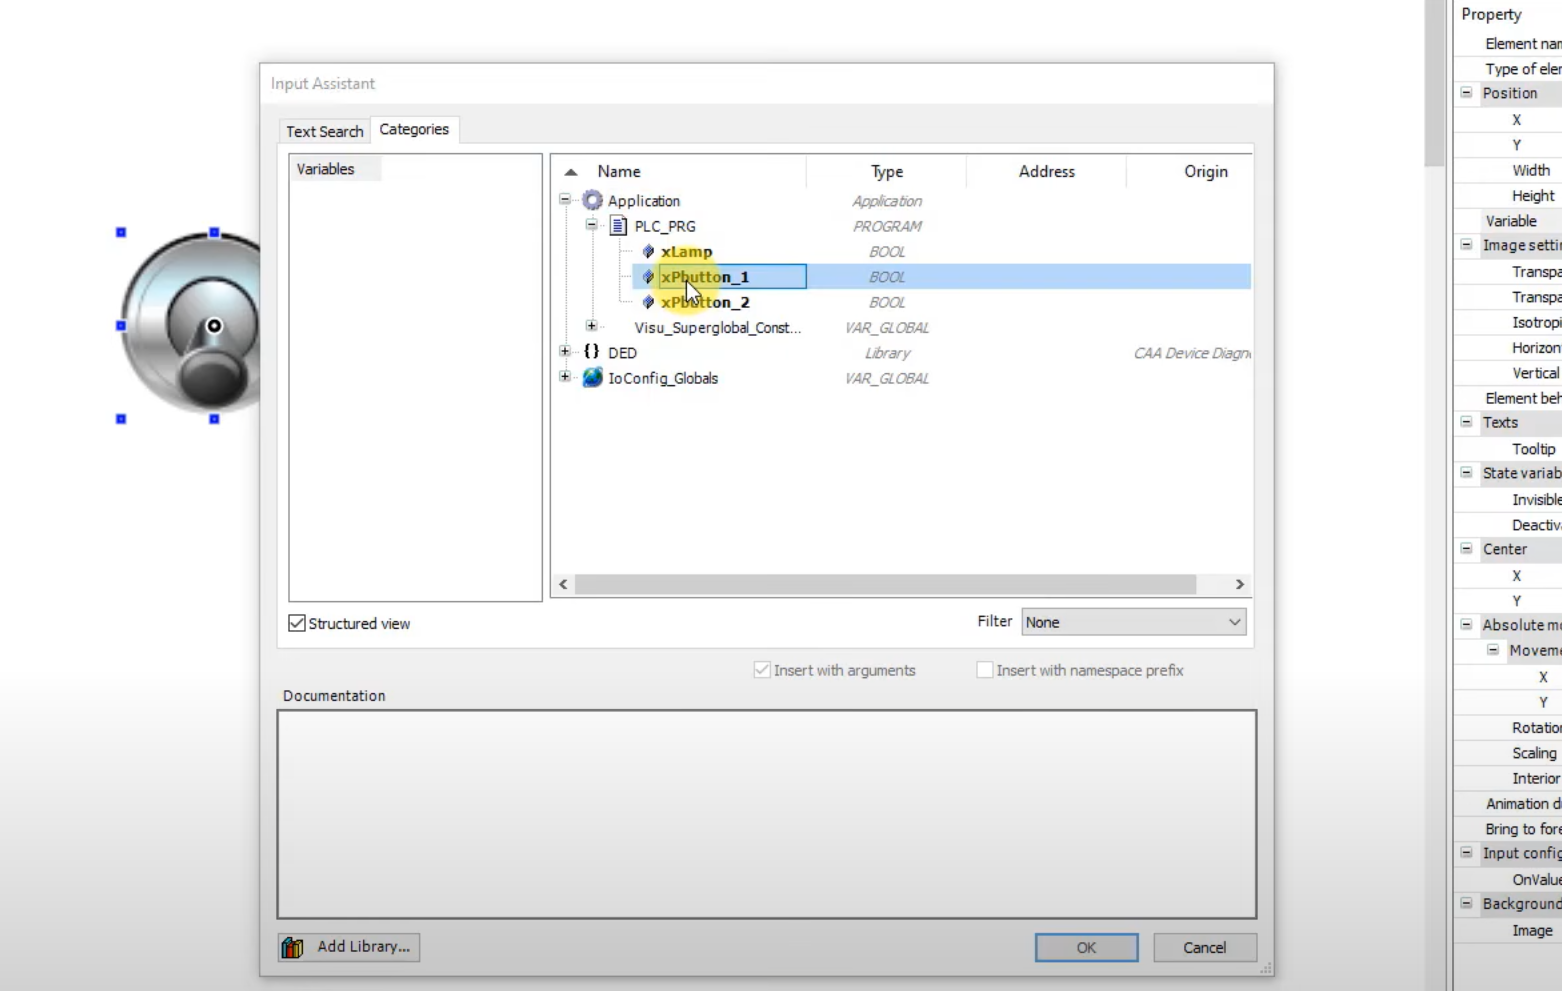
- In the Variable field, double-click and select the three dots (…).
- Expand Application, go to PLC_PRG, and select the xPB_Button1 variable.
- Press Enter to confirm.
- Repeat this process for the next button, selecting the xPB_Button2 variable.
- Connect the lamp to the appropriate variable (xLamp) and confirm by pressing Enter.
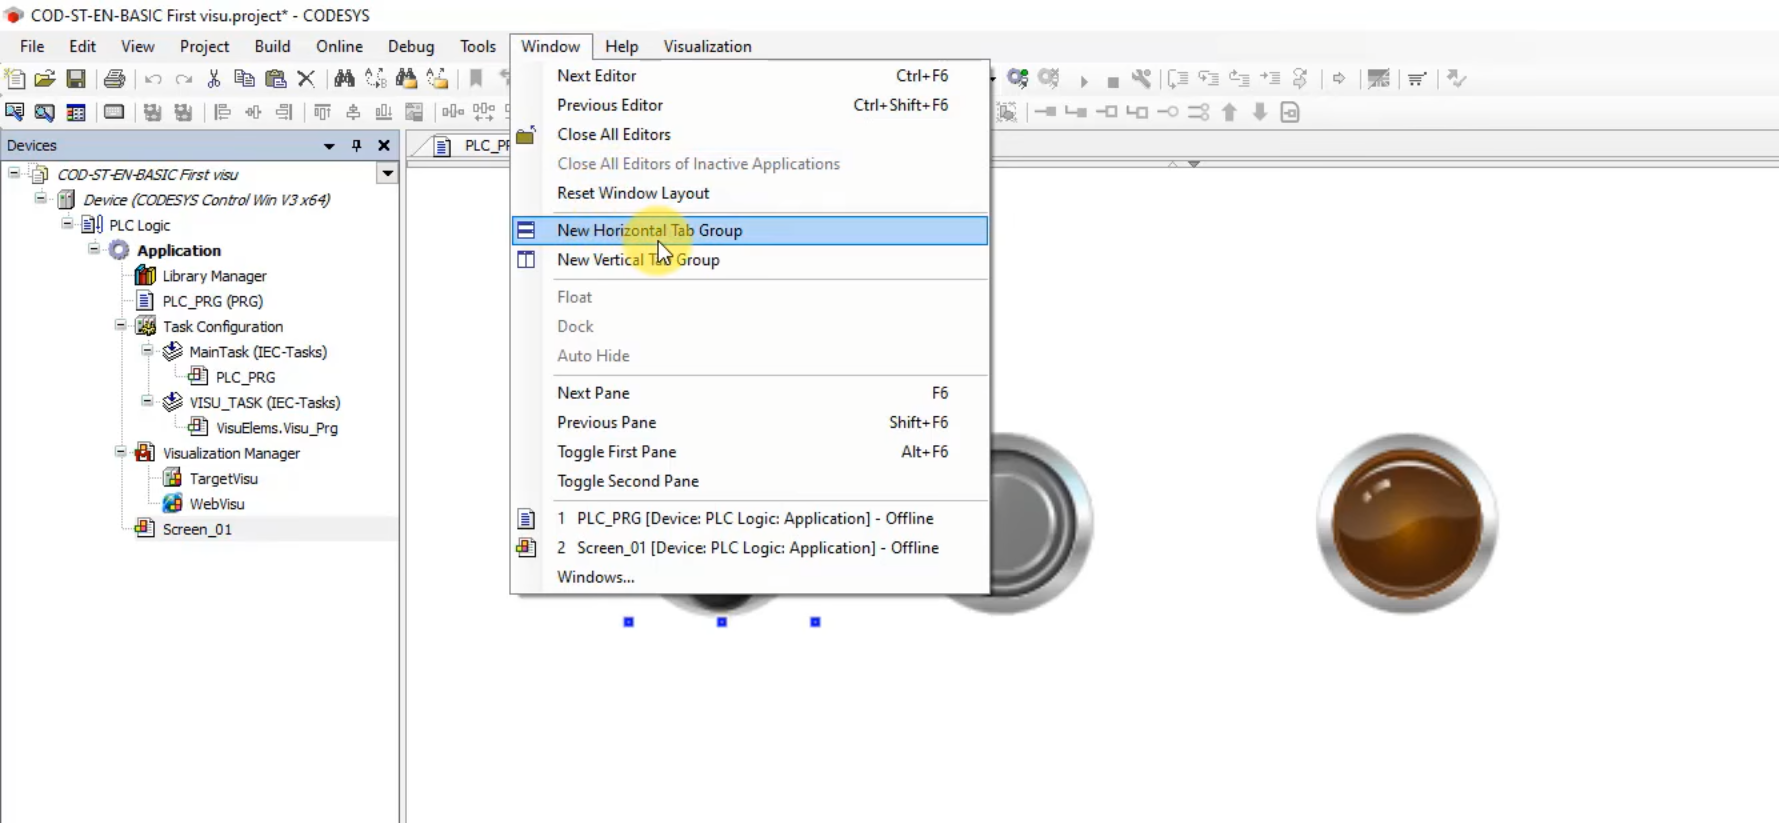
Testing the Program using codesys
- Close the Visualization Manager.
- Make sure you have two screens open – PLC_PRG and Screen_01.
- Go to Window and set them as New Horizontal Tab Group.
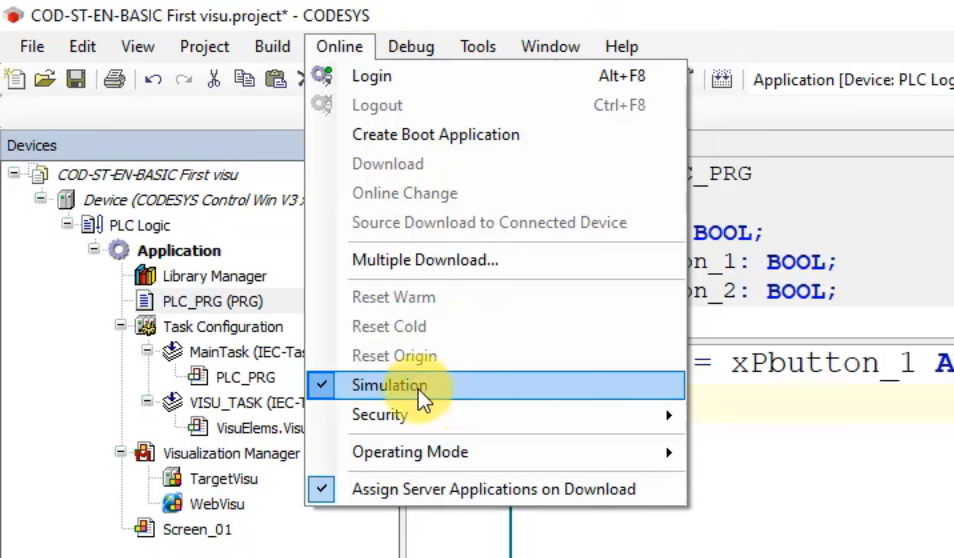
- Navigate to Online and select Download Program to Simulation.
- Ensure that you have checked the Simulation option.
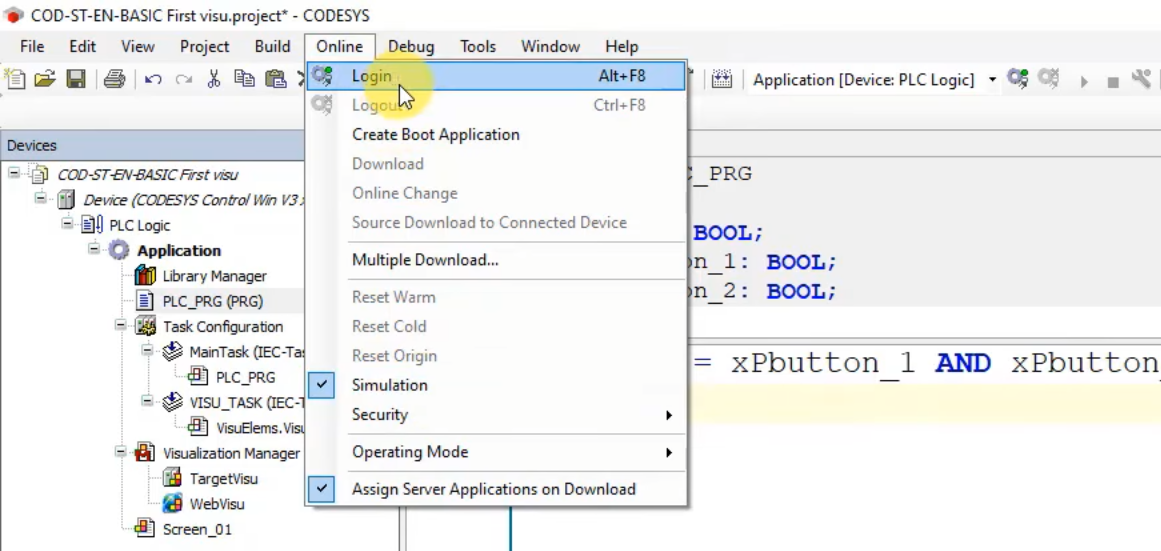
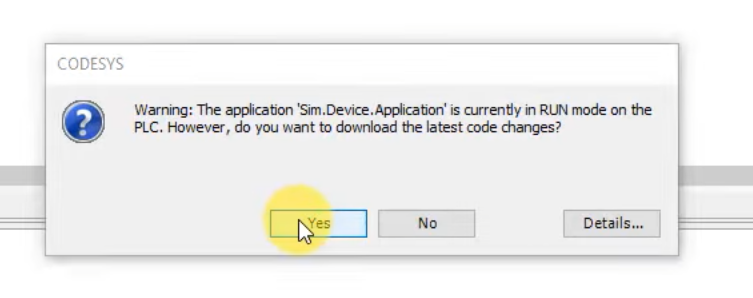
- Click Login, confirm by clicking Yes, and start the program.
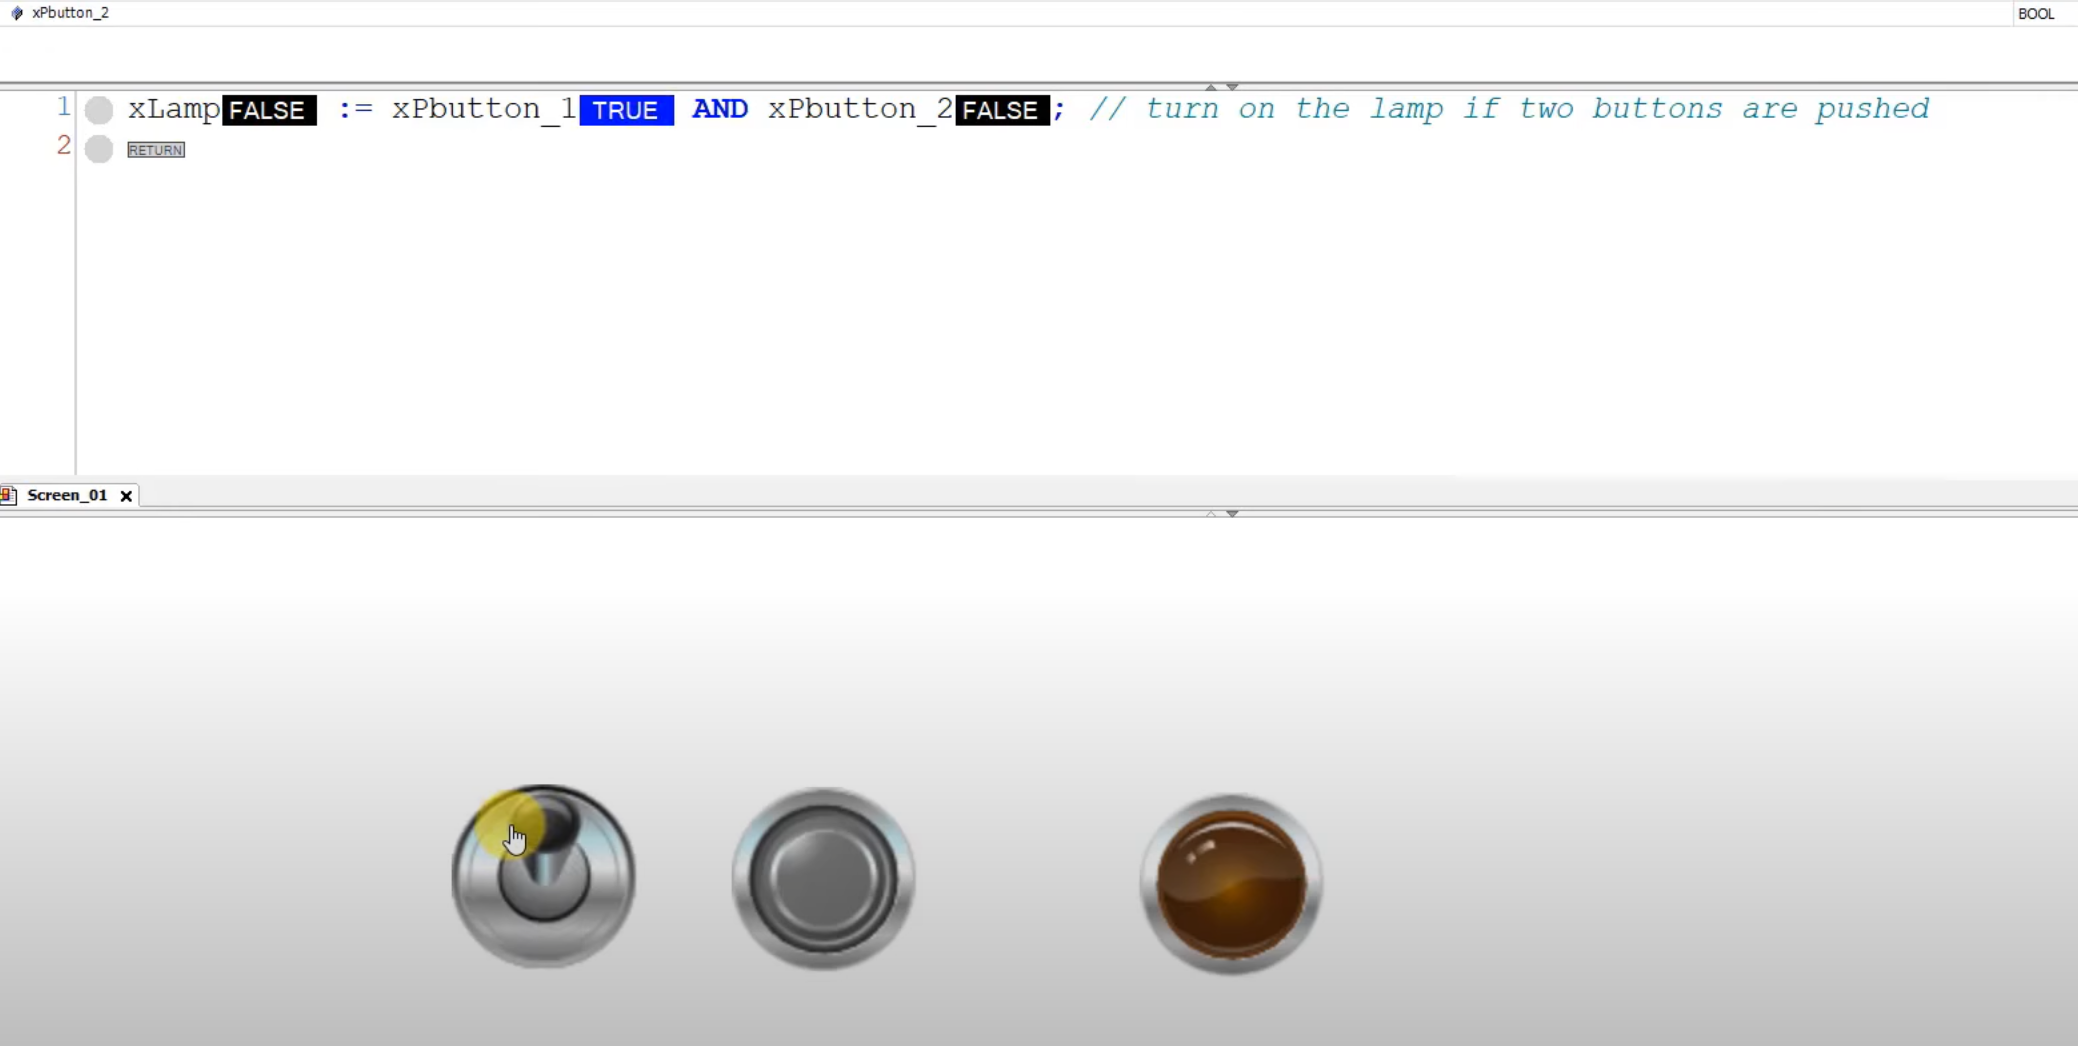
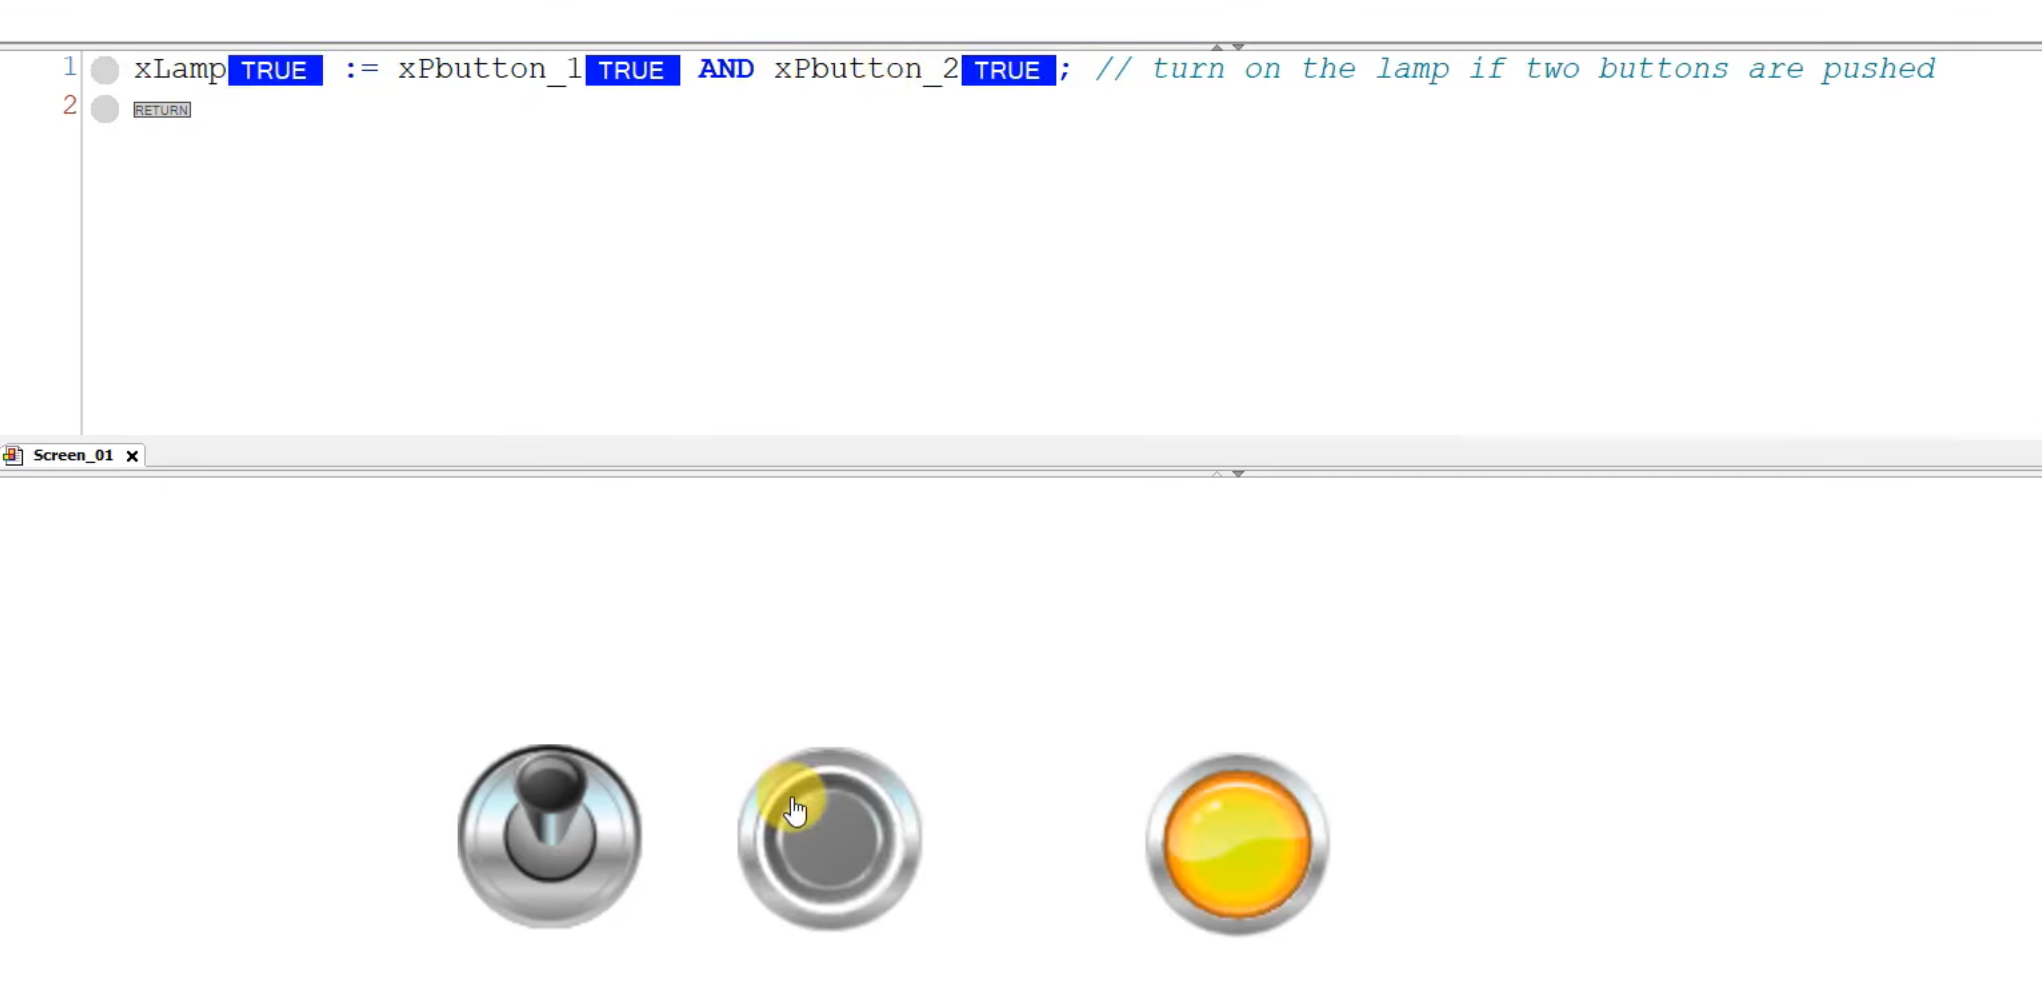
Checking the Buttons and Lamp Functionality
- Turn on the first button – the xPB_Button1 variable will change to True.
- To turn on the lamp, press the next button – the lamp should light up.
Conclusion
Congratulations! You have successfully created a simple Codesys Visualization and connected interface elements to variables. If you want to enhance your automation programming skills, remember the basics of variables – we will explore this topic in future posts.
Free PLC course outline
- Lesson #1: What Is It and Why Should Every PLC Programmer Know It? Part #1
- Lesson #2: How to install Codesys? Part #2
- Lesson #3: Write your first program in Codesys: Structured Text – Part #3
- Lesson #4: How to Create a Codesys Visualization in an Application? – Part #4
- Lesson #5: Introduction to Variables in CODESYS – Part #5
- Lesson #6: Data Structures in CODESYS: Practical Use of Arrays and Structures – Part #6
- Lesson #7: Advanced Data Types. Enumerations and Local vs. Global Variables – Part #7
- Lesson #8: Operators – Introduction and Practical Applications – Part #8
- Lesson #9: Program Flow Control: IF, CASE, and Loops – Part #9